Specifically, traditional analytics dashboards like Google Analytics 4 (GA4) deliver crucial macro metrics: traffic sources, bounce percentages, session duration, and overall conversion completions. However, aggregate numerical data only reveals what transpired on a website. It cannot explain why a high-intent commercial buyer abandoned your pricing calculator, or why 40% of mobile visitors leave your contact page without completing a single form input.
Therefore, deploying visual session forensics, aggregated scroll heatmaps, and click telemetry bridges this vital diagnostic gap. In particular, Florida business leaders using our Conversion Rate Optimization (CRO) Frameworks observe real user behavior with forensic clarity. As a result, businesses eliminate mobile friction points, accelerate form completion rates, and maximize inbound lead volume.
The Three Behavioral Anomalies That Destroy Mobile Conversions
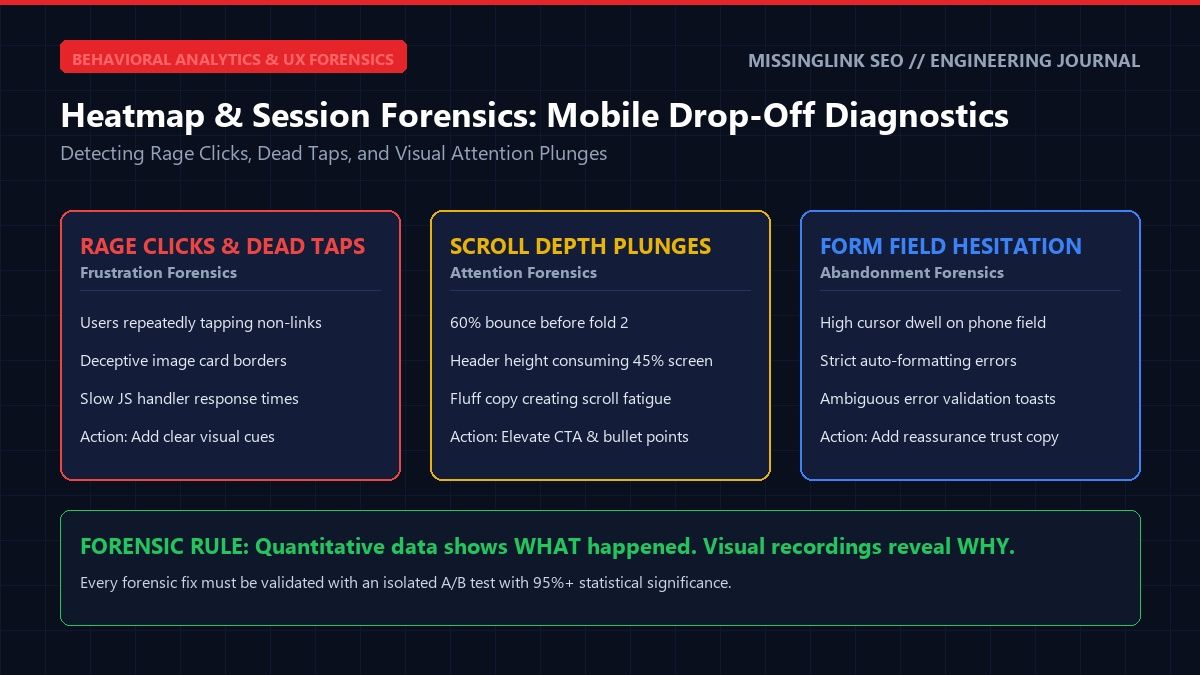
To begin with, studying hundreds of recorded user sessions across commercial service websites reveals that drop-offs consistently cluster around three distinct behavioral patterns. Recognizing these symptoms allows engineering teams to implement targeted interface corrections:
For example, when a mobile prospect taps on a service badge that appears interactive but yields no response, frustration escalates rapidly. Specifically, session tracking records this interaction as a dead tap. As a result, the visitor loses confidence in the site's reliability and returns to the search engine results page.
Formulating Controlled Hypotheses from Heatmap Telemetry
A frequent error among website owners is redesigning web pages based purely on subjective impressions. Rather than guessing what design changes might improve sales, conversion architects formulate rigorous mathematical hypotheses grounded in recorded session evidence.
For instance, an empirical testing hypothesis follows a clear logical structure: "Observed heatmap telemetry reveals that 44% of mobile visitors dead-tap our static service comparison cards expecting expandable details. By transforming these cards into interactive accordions with direct booking triggers, we hypothesize mobile form starts will rise by 20% at a 95% statistical confidence level."
In addition, pairing forensic discoveries with the psychology outlined in our guide on Multi-Step Lead Form Psychology eliminates user hesitation during checkout and lead submission. Additionally, structuring page layouts around the trust principles detailed in our Anatomy of High-Converting Service Landing Pages compounds overall marketing return on investment.
Mobile Viewport Constraints and Touch Target Sizing
Over the past 25 years of web engineering at MissingLink SEO, we have observed that mobile interfaces create unique friction challenges. Specifically, mobile visitors navigate using thumb taps rather than precision mouse pointers.
Because fingers lack mouse pointer precision, interactive elements with touch targets smaller than 48 by 48 CSS pixels cause frequent accidental clicks. When a user accidentally taps an adjacent privacy link while attempting to submit an estimate request, friction multiplies instantly.
Instead, modern frontend engineering ensures all buttons, select menus, and interactive badges maintain generous touch padding. In addition, eliminating layout shifts through our Website Speed & Performance Optimization Services prevents interactive elements from shifting position while a visitor is attempting to tap them.
Integrating Qualitative Session Data with Quantitative Business Goals
While heatmaps illuminate user frustration, conversion rate optimization succeeds by tying qualitative findings directly to business revenue metrics. Specifically, tracking how micro-interactions affect final contract values allows companies to prioritize engineering fixes that generate immediate financial return.
For example, resolving a high-friction form field on an enterprise consultation page can unlock hundreds of thousands of dollars in new client pipeline. By pairing behavioral forensics with clean technical foundations as outlined in our Core Web Vitals & INP Optimization Guide, your digital presence turns passive search traffic into closed contracts.
Accordingly, businesses experiencing stagnant conversion rates should explore our full-service Conversion Rate Optimization (CRO) Services to systematically diagnose friction and maximize website earnings.
Related Engineering Blueprints & Service Pillars
Explore complementary technical guides and foundational service hubs from MissingLink SEO:
- Core Service Hub: Conversion Rate Optimization (CRO) Services
- Specialized Service: Website Speed & Performance Optimization
- Lead Psychology: Multi-Step Lead Form Psychology
- Landing Page Blueprint: Anatomy of High-Converting Landing Pages
Ready to Stop Conversion Leakage?
Deploy forensic session heatmaps, user journey audits, and controlled A/B testing with our complete Conversion Rate Optimization Services.
Claim Your Free Funnel Audit