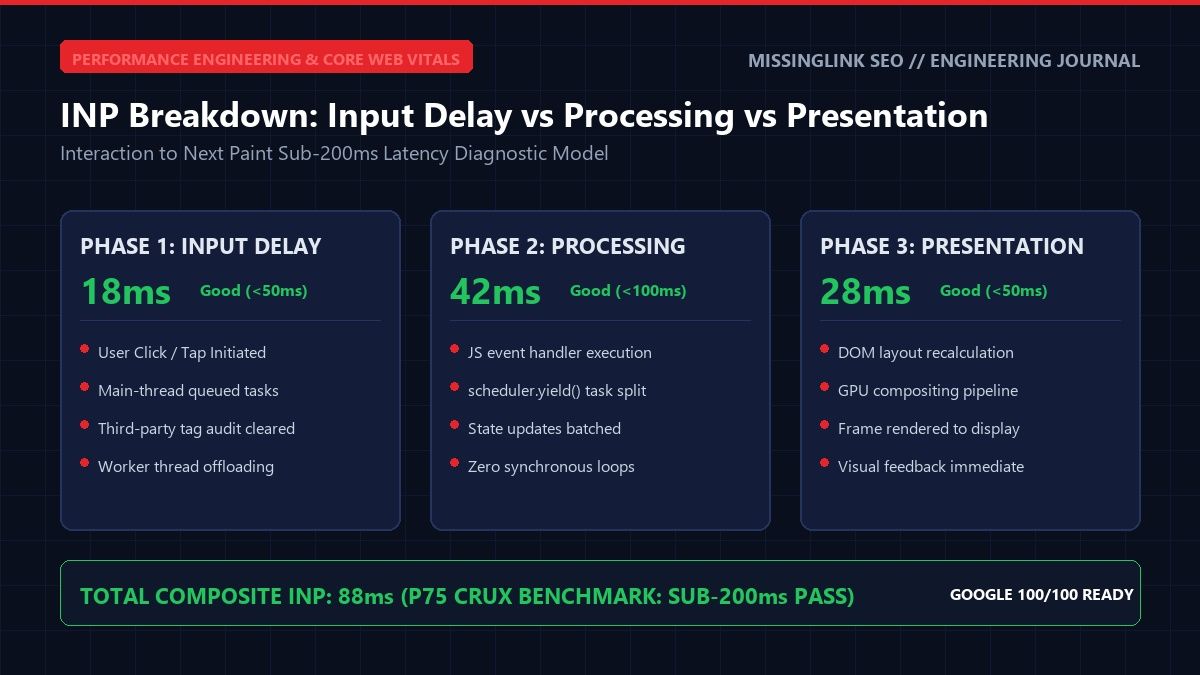
Specifically, Google has cemented Interaction to Next Paint (INP) as a permanent Core Web Vitals ranking factor within the Page Experience algorithm. While First Input Delay (FID) measured solely the initial interaction latency, INP tracks the responsiveness of every single click, tap, and keyboard entry throughout the full lifespan of a user visit. Therefore, websites that exhibit delayed interface feedback or sluggish JavaScript processing suffer quantifiable drops in organic search visibility.
Because search engines demand exceptional responsiveness, engineering clean frontend architecture is now mandatory for high-intent business funnels. In particular, Florida business owners investing in Technical SEO Audits must resolve main-thread contention before launching aggressive marketing campaigns. When a mobile visitor encounters frozen buttons or sluggish menus, user frustration spikes and conversion rates collapse immediately.
Deconstructing the Three Discrete Sub-Phases of INP
To systematically engineer a website to achieve sub-200ms INP marks across all devices, developers must first dissect how the browser handles user events. Specifically, each user interaction is divided into three distinct execution stages:
For example, when a mobile shopper on an ecommerce store taps "Add to Cart", the browser queue determines how fast the next graphical frame renders. If third-party tracking libraries occupy the main thread, the input delay alone can exceed 300ms. As a result, Google classifies the entire interaction as poor, penalizing the domain in the real-user Chrome User Experience Report (CrUX).
Code Implementation: Task Chunking with scheduler.yield()
Historically, web developers attempted to yield execution using setTimeout(fn, 0) or requestAnimationFrame(). However, modern Chromium browsers now support the native Prioritized Task Scheduling API. Specifically, the scheduler.yield() method allows scripts to temporarily pause heavy JavaScript loops, enabling the browser compositor to draw the user feedback frame before resuming computation.
In addition, writing an asynchronous wrapper guarantees backward compatibility across older safari and mobile engines:
// Modern Task Splitting Utility for Sub-200ms INP
async function yieldToMainThread() {
  if ('scheduler' in window && 'yield' in window.scheduler) {
    return await window.scheduler.yield();
  }
  // Fallback for legacy browsers
  return new Promise(resolve => {
    setTimeout(resolve, 0);
  });
}

// Processing heavy dataset without freezing user interface
async function processDataChunks(items) {
  for (let i = 0; i < items.length; i++) {
    computeFilterLogic(items[i]);

    // Yield every 40 items to ensure click events execute immediately
    if (i % 40 === 0) {
      await yieldToMainThread();
    }
  }
}
Because this utility yields back to the browser event dispatcher, user input is never ignored or delayed. Therefore, interactive widgets such as autocomplete dropdowns, lead calculators, and navigation drawers open instantaneously without frame drops.
Eliminating Third-Party Script Bloat and Main-Thread Lockup
In over 25 years of building web architectures at MissingLink SEO, we have discovered that bloated third-party marketing tags cause 80% of INP failures. For instance, WordPress plugins and heavy theme frameworks frequently bundle multiple analytics tools, video players, chat widgets, and social tracking pixels that parse simultaneously on mobile devices.
Instead of executing dozens of tracking scripts on the client device, modern architectures shift this workload to cloud proxies. As discussed in our detailed guide on Meta CAPI & Server-Side GTM Setup, transmitting events via cloud containers cuts client-side JavaScript by upwards of 450 kilobytes. Accordingly, main-thread CPU time drops drastically, allowing mobile devices to respond instantly to touch interactions.
Similarly, evaluating your CMS foundation is critical. In our architectural comparison of Custom Code vs Heavy CMS Page Builders, tests demonstrate that bloated drag-and-drop builders generate excessive DOM depth and unminified CSS. This overhead directly inflates presentation delay during user clicks.
Preventing Forced Reflows and Layout Thrashing
While JavaScript CPU time is a recognized issue, presentation delay often stems from poor CSS and DOM handling. Specifically, layout thrashing occurs when JavaScript repeatedly alternates between reading geometry properties (such as offsetWidth or getBoundingClientRect()) and writing style mutations back to the DOM.
To illustrate this problem, consider an accordion menu where expanding an item forces the browser to recalculate the entire page document structure. If multiple layout recalculations happen in rapid succession, the mobile browser drops below 60 frames per second, extending the interaction time past Google's acceptable threshold.
Instead, developers should batch all DOM reads first, followed by isolated CSS class mutations. In addition, leveraging hardware-accelerated CSS properties like transform and opacity avoids recalculating parent geometry entirely, ensuring buttery smooth rendering under high-stress mobile conditions.
Diagnostic Tools: Chrome DevTools and Long Animation Frames (LoAF)
When auditing interaction responsiveness, developers must move beyond simulated synthetic benchmarks like basic Lighthouse audits. While Lighthouse provides useful baseline data, it cannot replicate actual multi-click user sessions across hundreds of device configurations.
Instead, professional engineers analyze the Long Animation Frames API (LoAF) within Google Chrome. Specifically, LoAF surfaces animations that delay rendering by more than 50 milliseconds, pinpointing the exact script URL, function name, and execution line responsible for the UI stall. In our agency workflows at Website Speed Optimization Services, we isolate these problematic script handles directly within the Chrome DevTools Performance panel, eliminating bottlenecks at their source.
Related Engineering Blueprints & Service Pillars
Explore complementary technical guides and foundational service hubs from MissingLink SEO:
- Core Service Hub: Technical SEO & Speed Audits
- Specialized Service: Website Speed & Core Web Vitals Optimization
- Architecture Guide: Custom Code vs Heavy CMS Page Builders
- Server-Side Tracking: Meta CAPI with Server-Side GTM Setup
Need Sub-Second Speed Engineering for Your Business?
Explore our complete Technical SEO & Speed Optimization Services to resolve Core Web Vitals issues, boost mobile rankings, and eliminate interaction delays.
Claim Your Free Speed Audit